To determine whether or not an upcoming night sky will be good for observations, we use a variety of online tools. The ones listed below showcase some of the factors mentioned on our Sky Conditions page along with some others.
These online resources can be used to determine how optimal the sky conditions in your area are for observational astronomy with visible light. In general, they are most accurate up to 48 hours in advance, but in any case, all of them should be checked before making a call. Since they all use different data sources and forecasting models, the forecasts can be different. You should be wary of drastically different forecasts, particularly if only one hour differs from the remainder of the night. Over time, you’ll find the tool that forecasts sky conditions for your area the best. At UMBC, we always compare all four of the below — and sometimes others!
NOAA
This website has two interesting features. Both are related to cloud cover. One is the satellite imagery provided by geostationary, Earth-observing satellites and the other is the graphical “sky cover percentage” forecast.
To check the current cloud coverage in your area, put in your zip code on the top-left of the home page. Then scroll down to the bottom-right under the “Additional Resources” section.
“Radar & Satellite Image” will take you here:
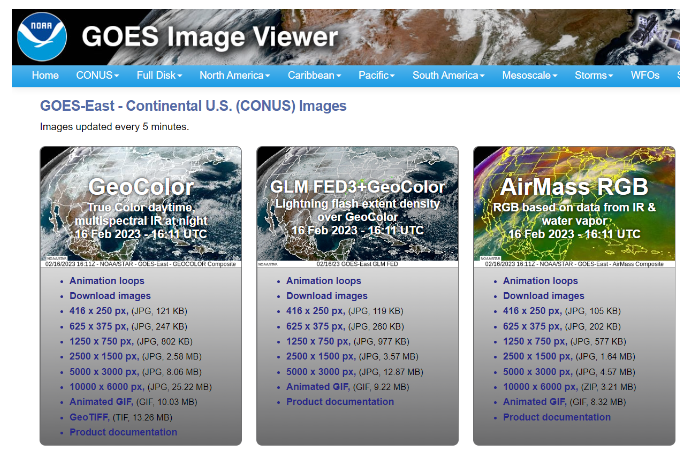
The GeoColor Images on the far left will give an animation of clouds over the past two hours. This is helpful because it can show the trajectory of clouds that are currently passing over us.
Another one of the images, Band 4, looks in infrared specifically for cirrus clouds. See our page on Sky Conditions for more information.
Clicking the “Hourly Weather Forecast” brings you to a page with quite a few charts showcasing the temperature, wind, humidity, and more. The most important feature of this website is the sky cover line (in blue) in the third row of charts. A good night for doing observations usually has below 10% sky coverage.
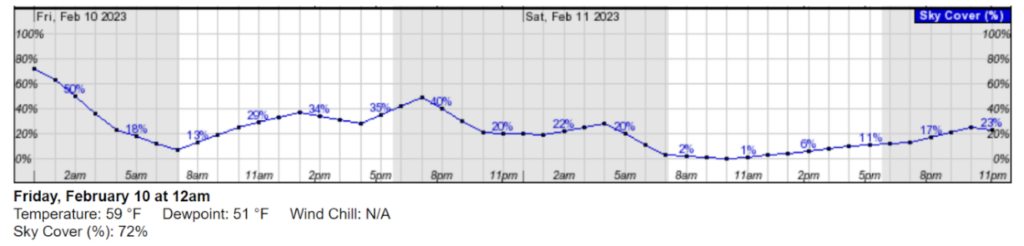
Hovering over an hour will list the exact temperature and sky cover percentage right below the graph, too!
Wunderground
At the top-right of the home page, put in a city or a location. The resulting page shows a variety of forecasts, including “HOURLY” and “10-DAY” forecasts.
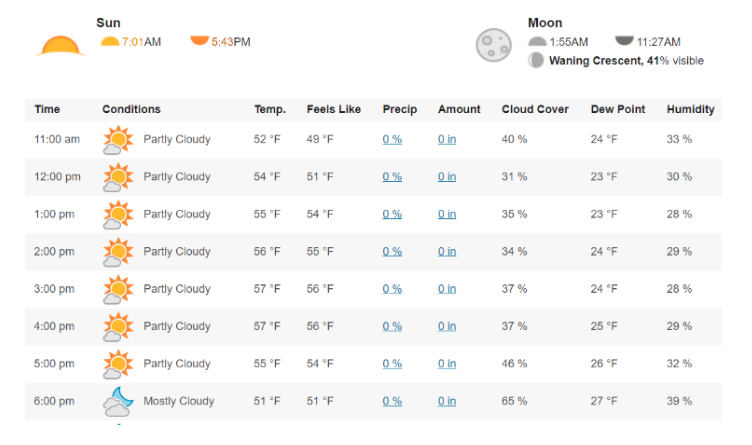
The hourly forecast, shown above, shows cloud coverage and humidity for each hour of the day. It also gives the exact times of the sunrise and sunset. You can expand this forecast coverage and also switch to the 10-day view with a graphical interface.
Astrospheric
https://www.astrospheric.com/?Latitude=39.254390716553&Longitude=-76.71150970459
At the top of the website, there is a blue search button, which gives the option to center the forecast on a specific area. Center your location in the red circle and click “Get New Forecast”.
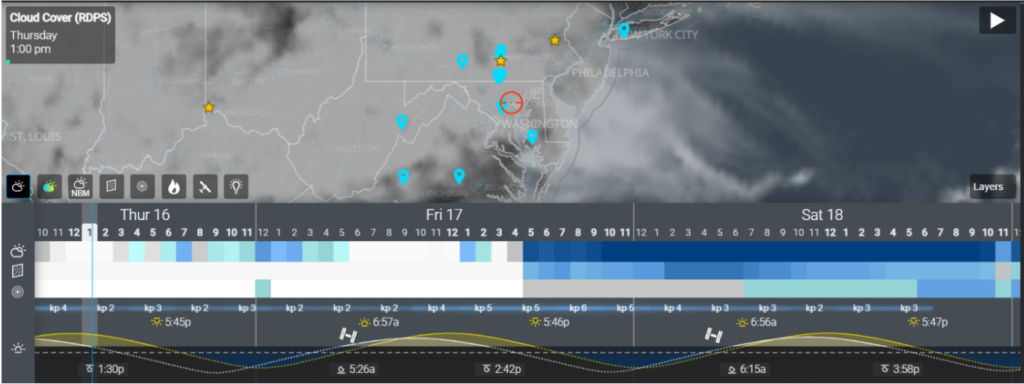
It will generate a forecast that looks like the image above. Hitting the button at the top right will play an animation of the expected hourly movement of the clouds over the next couple of days. You can also toggle each button to show a different factor, such as transparency, smoke, and light pollution.
Note that for the sky cover, transparency, and seeing: a darker color indicates better sky conditions and gray indicates poorer sky conditions.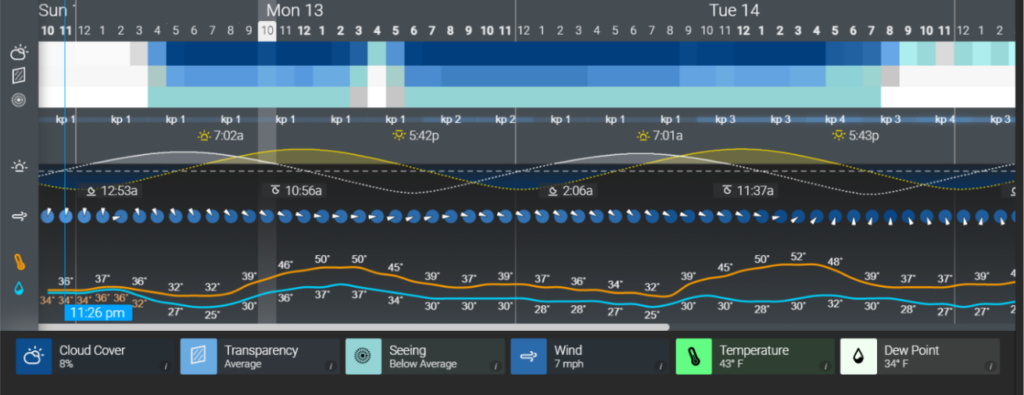
In addition to presenting cloud coverage, transparency, and seeing, Astrospheric also shows the temperature and dew point temperature. A dew point temperature close to the current temperature can indicate a chance of rain, fog, or dewing.
Clicking on any of the times will give a more detailed list of information at the bottom with estimated percentages. The image above shows details for Monday February 13, 2023 at 10pm (Note the highlighted “10” above).
Clear Dark Sky
https://www.cleardarksky.com/c/UMBCObMDkey.html?1
This is a general chart that shows each category at each hour up to three days in advance.
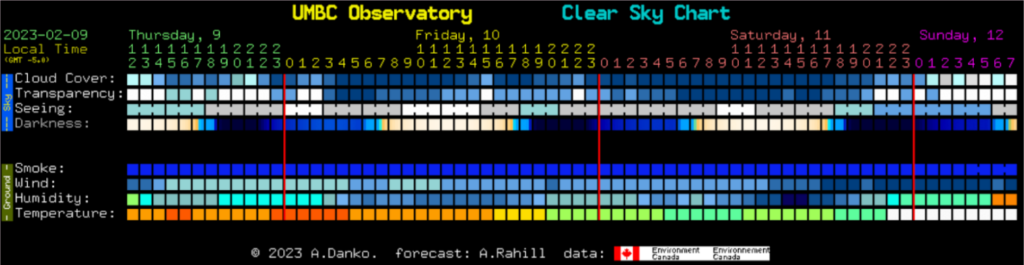
Clear Dark Sky has four main categories that are important. For all of them, a darker color indicates better sky conditions and gray indicates poorer sky conditions:
- Cloud Cover
- Transparency
- Seeing
- Darkness – This category shows when the sky will be dark on a scale that ranges from -4 (bright) to 6.5 (dark). This is based on the phase of the Moon or the time of day, as this will be white/yellow during a full moon or during the day. Black indicates a dark sky, light blue indicates a full moon, and white indicates daylight.
For the UMBC Observatory Weather Rotation
Check each of these sources and post a brief report for each day as follows:
NOAA Weather Forecast: X% cloud coverage, humidity around Y%
Wunderground: X% cloud coverage, humidity around Y%
Astrospheric: Cloud coverage is [descriptor], transparency is [descriptor], seeing is [descriptor]
ClearDarkSky: Cloud coverage is [descriptor], transparency is [descriptor], seeing is [descriptor]
While “on duty”, Froggy maintains complete discretion with regard to determining whether or not an observing session will take place. The director retains the right to DM Froggy to second guess any reports.
Froggy must ensure at least the following
- Cloud cover is forecast to be less than 10-15% for at least four hours after sunset according to a consensus of the resources listed above
- At least three people are available to participate, which must include at least one person with the role Observatory Expert on Discord
- There is an observation plan communicated to those participating